
OPINION — Goldenomics 103: Gold Protects and Performs
This opinion piece was submitted to the Investing News Network (INN) by Darren Brady Nelson, who is an external contributor. INN believes it may be of interest to readers and has copy edited the material to ensure adherence to the company’s style guide; however, INN does not guarantee the accuracy or thoroughness of the information reported by external contributors. The opinions expressed by external contributors do not reflect the opinions of INN and do not constitute investment advice. All readers are encouraged to perform their own due diligence.
By Darren Brady Nelson
US President Donald Trump’s “Liberation Day” tariffs certainly caused quite the stir in the markets on April 2.
Gold dropped about 6 percent, and silver 12 percent. A week later, a pause was announced, which ended on August 1. Gold and silver have since risen approximately 11 percent and 24 percent, respectively.
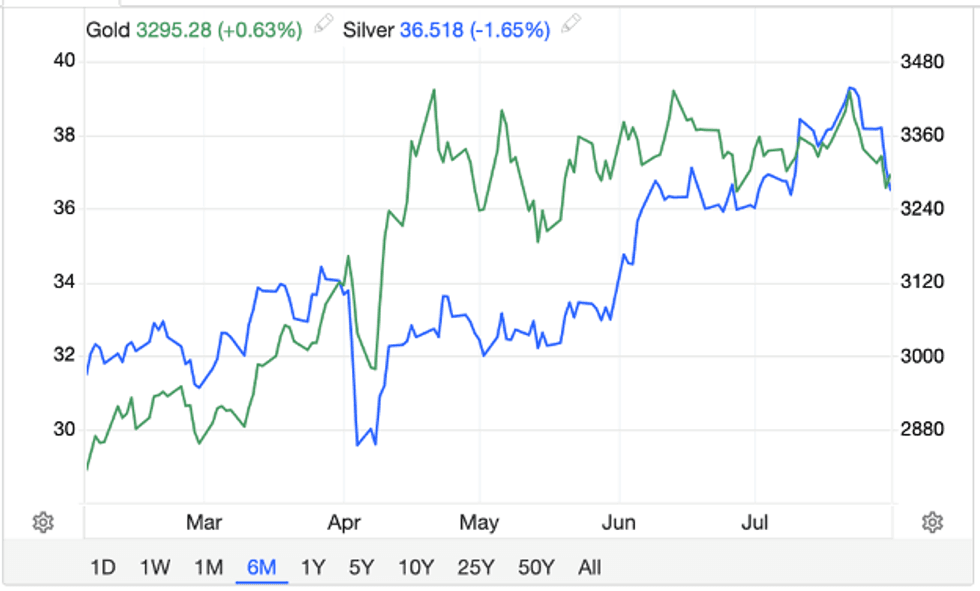
Six month gold and silver price performance.
Source: Trading Economics (gold) and (silver).
Unless you are a professional, or even amateur, trader, it is best to look at gold and silver investment with a perspective of years or decades, rather than just days, weeks or even months. Since the start of the COVID-19 panic in March 2020, gold and silver have exploded 123 percent and 192 percent.
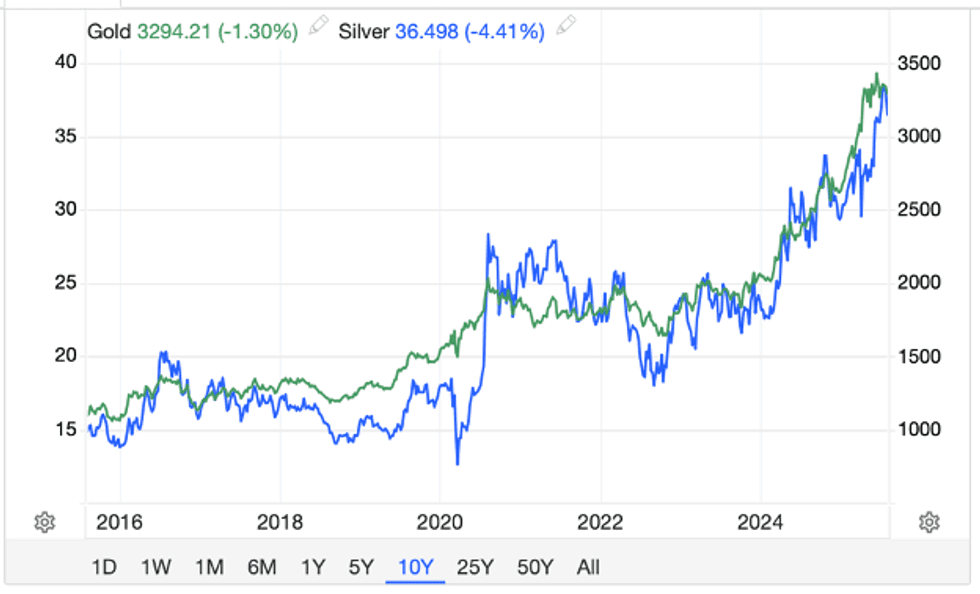
10 year gold and silver price performance.
Source: Trading Economics (gold) and (silver).
In the shorter term, the gold price is driven by what economist John Maynard Keynes called “animal spirits.” In the longer term, it is driven by “monetary spirits.” And not just as protection, but also for performance. The Presidential Gold Guide highlights both in chapters four and five.
Gold unsurprisingly protects
Economist and investor Mark Skousen has wisely noted that: “Since we left the gold standard in 1971, both gold and silver have become superior inflation hedges.” Gold has more than countered the results of inflation, as measured by CPI, and the drivers of inflation, as measured by M3.
And the numbers back that up. The Gold Protects chart below compares the gold price, CPI and M3 in terms of cumulative growth of each from 1971 to 2025. That is throughout the whole era of gold as an investment, which officially started in 1974 once private ownership was restored.
During this era, gold grew by 541 percent, CPI by 214 percent and M3 by 384 percent. Annual average growth for gold was 10 percent, CPI at 4 percent and M3 at 7 percent. Maximums were 92 percent, 14 percent and 29 percent, respectively. CPI only failed to grow twice, ie. 0 percent in 2009 and 2015. M3 decreased twice, by -4 percent in 2023 and -6 percent in 2024.
Gold surprisingly performs
The highly respected In Gold We Trust (IGWT) report states: “When dealing with the specific level of gold allocation, it is advisable to differentiate between safe-haven gold and performance gold.
Read More: OPINION — Goldenomics 103: Gold Protects and Performs