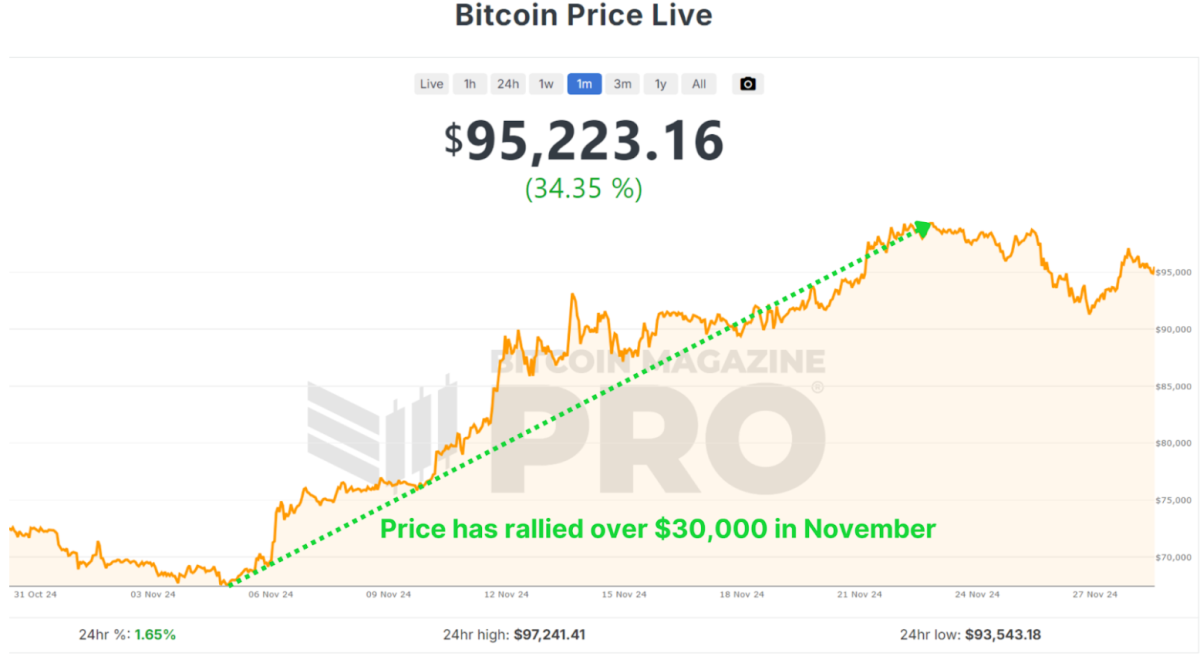
Bitcoin is closing out one of its most remarkable months in history, surging over $30,000 in November and marking a renewed bullish sentiment in the market. As we look ahead to December and beyond, investors are eager to understand whether Bitcoin’s momentum can sustain itself into 2025. With macroeconomic conditions, historical trends, and on-chain data aligning in Bitcoin’s favor, let’s analyze what’s happening and what it could mean for the future.
November’s Record-Breaking Performance
November 2024 wasn’t just any month for Bitcoin; it was historic. Bitcoin’s price rose from around $67,000 to nearly $100,000, an approximate 50% peak-to-trough increase, making it the best-performing month ever in terms of dollar increase. This rally rewarded long-term holders who endured months of consolidation after Bitcoin’s all-time high of $74,000 earlier in the year.

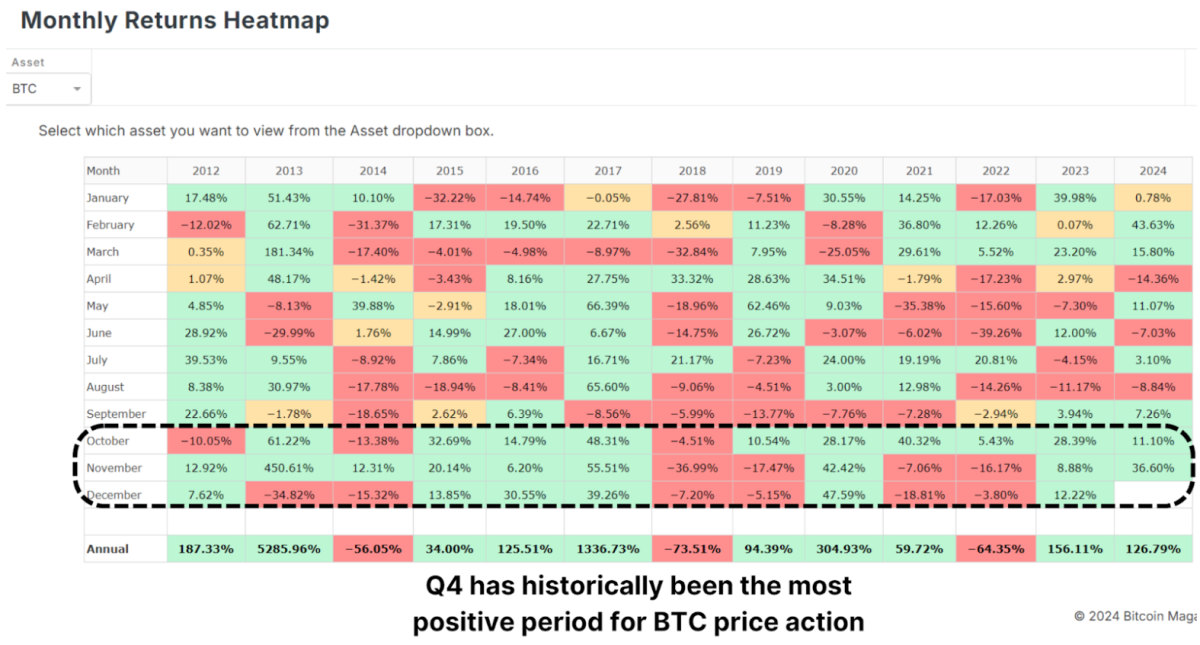
Historically, Q4 is Bitcoin’s strongest quarter, and November has often been a standout month. December, which has also performed well in past bull cycles, presents a promising outlook. But as with any rally, some short-term cooling might be expected.

The Role of the Dollar and Global Liquidity
Interestingly, Bitcoin’s rise occurred against the backdrop of a strengthening U.S. Dollar Strength Index (DXY), a scenario that typically sees Bitcoin underperforming. Historically, Bitcoin and the DXY have maintained an inverse relationship: when the dollar strengthens, Bitcoin weakens, and vice versa.
Similarly, the Global M2 money supply, another key metric, has shown a slight contraction recently. Bitcoin has historically correlated positively with global liquidity; thus, its current performance defies expectations. If liquidity conditions improve in the coming months, this could act as a powerful tailwind for Bitcoin’s price.
Parallels to Past Bull Cycles
Bitcoin’s current trajectory is strikingly similar to past bull markets, particularly the 2016–2017 cycle. That cycle began with gradual price increases before breaking key resistance levels and entering an exponential growth phase.
In 2017, Bitcoin’s price broke out from a key technical level of around $1,000, leading to a parabolic rally that…
Read More: Will December Surpass November’s Record-Breaking Bitcoin Price Increase?

