

- The famous Warren Buffett indicator for assessing whether the market is undervalued or overvalued is heading to record highs
- Market breadth is also showing warnings signs on a historical level
- Despite that, the current seasonality pattern favors the bulls
- Unlock AI-powered Stock Picks for Under $8/Month: Summer Sale Starts Now!
The Buffett indicator originated in 2001 when the legendary Oracle (NYSE:) of Omaha stated that the ratio of stock market capitalization to gross domestic product (GDP) is the best way to determine whether the market is overvalued or undervalued.
Here’s how it works: the indicator takes the total market capitalization of all listed U.S. stocks and divides it by the latest quarterly figure for U.S. GDP.
– If the ratio is less than 0.7, the market is considered undervalued.
– If the ratio is between 0.9 and 1.0, the market is viewed as fairly valued.
– If the ratio exceeds 1.2, the market is deemed overvalued.
Currently, the indicator is approaching an all-time high.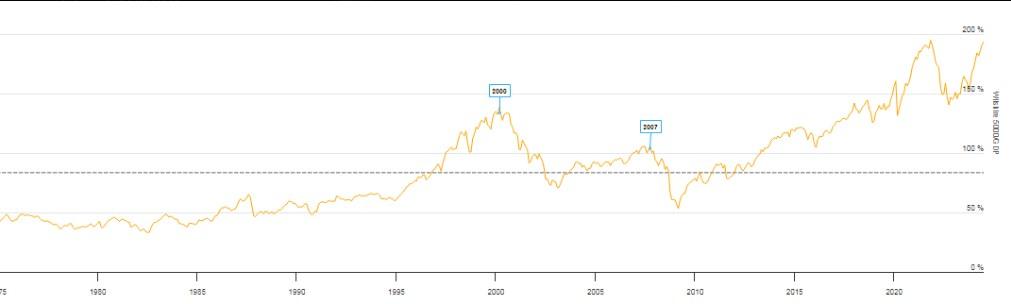
Source: Longtermtrends
This is not surprising, as the average P/E ratio of the also indicates that the market is expensive.
One reason for this is that company earnings forecasts are very high, yet they continue to be exceeded. This is why the market remains bullish despite its high valuation.
Breadth Also Short, But Seasonality in Favor of the Bulls – For Now
In 2024, the rose 14.5% in the first half of the year, marking the 15th best start in the past 96 years. However, without NVIDIA (NASDAQ:), the increase would have been 11%, and without the Magnificent 7, it would be even lower at 6%.
Currently, the top 10 stocks in the S&P 500 account for 77% of the index’s total gain, the second largest percentage in history, only behind 2007.
Longer-term, the bull run also appears extended – particularly when compared to other stock markets. The U.S. stock market has achieved a return of 502% over just over sixteen years. This is significantly higher than the 104% return of global stock markets and the 65% return of emerging markets. Never before has the North American market shown such strength over a 15-16 year period compared to the rest.
Given the tech sector’s strong influence on the U.S. stock market, comparisons to periods like the dot-com bubble are inevitable. However, these situations are not exactly alike. Although the S&P 500 has risen 85% in the past five years, this is modest compared to the 220% increase during the last five years of the Internet bubble.
But, despite that, seasonality continues to be in favor of the bulls. In the last 96 years, the S&P 500 has seen at least a 10% increase in the first six months only 29 times, typically ending those years with an average return of 24%.
Here are the stocks that hedge funds hold the most in their portfolios after the first quarter. While there are no major surprises, some may notice the absence of certain stock: Tesla (NASDAQ:).
-
Microsoft (NASDAQ:)
-
Amazon (NASDAQ:)
-
Alphabet (NASDAQ:)
-
Apple (NASDAQ:)
-
Read More: S&P 500: Buffett Indicator Nearing All-Time High – What That Means for