
Infographic: A New US Home Now Costs Under 100 Ounces of Gold
From late 2025 through mid-2026, a median-priced new US home cost less than 100 ounces of gold in every quarter, the first time that’s happened since data collection began in 1963. The previous low came in 1980, at the end of gold’s 1970s run, when the figure bottomed out at exactly 100 ounces.
The house price stood at 91 ounces in the second quarter of 2026, down 82 percent from 509 ounces in the first quarter of 1963, according to MiningVisuals’ analysis of US Census Bureau and HUD home-price data via FRED and World Bank gold prices.
Gold, not housing, drove most of the latest drop. Year-over-year, the Q2 median new-home price fell 1.3 percent, while gold’s quarterly average rose 37 percent, from US$3,293 to US$4,512 per ounce, according to World Bank commodity price data.
Builders keep a lid on dollar prices
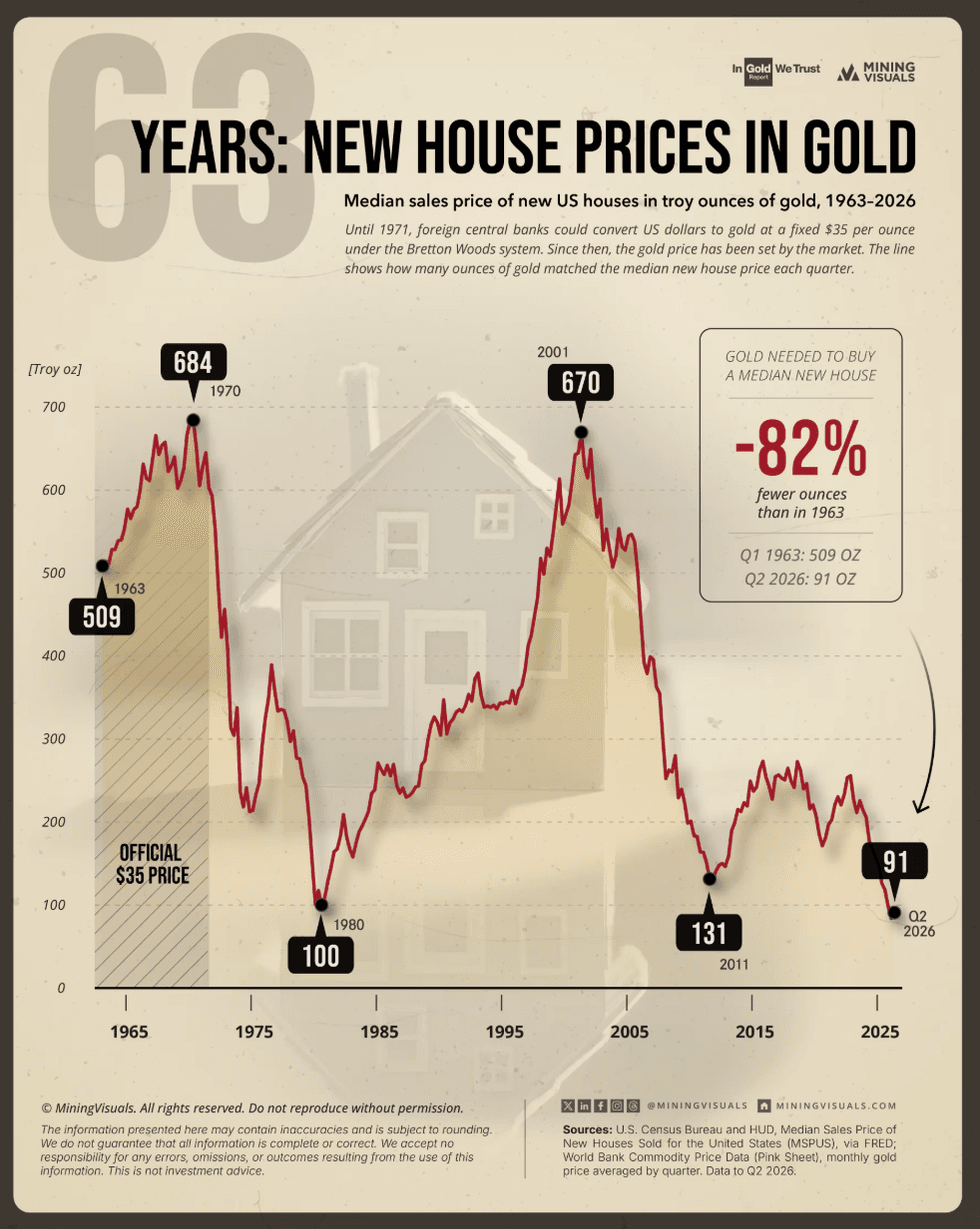
Infographic via MiningVisuals.
In dollar terms, the market has barely moved. FRED data show the quarterly median has held between US$408,500 and US$435,400 since 2023, after peaking at US$442,600 in the fourth quarter of 2022. It stood at US$410,700 in the second quarter of 2026.
Monthly figures have dipped lower. The Census Bureau’s July new-home report, released on August 25, put the median at US$393,800, which HousingWire noted was the lowest since July 2021.
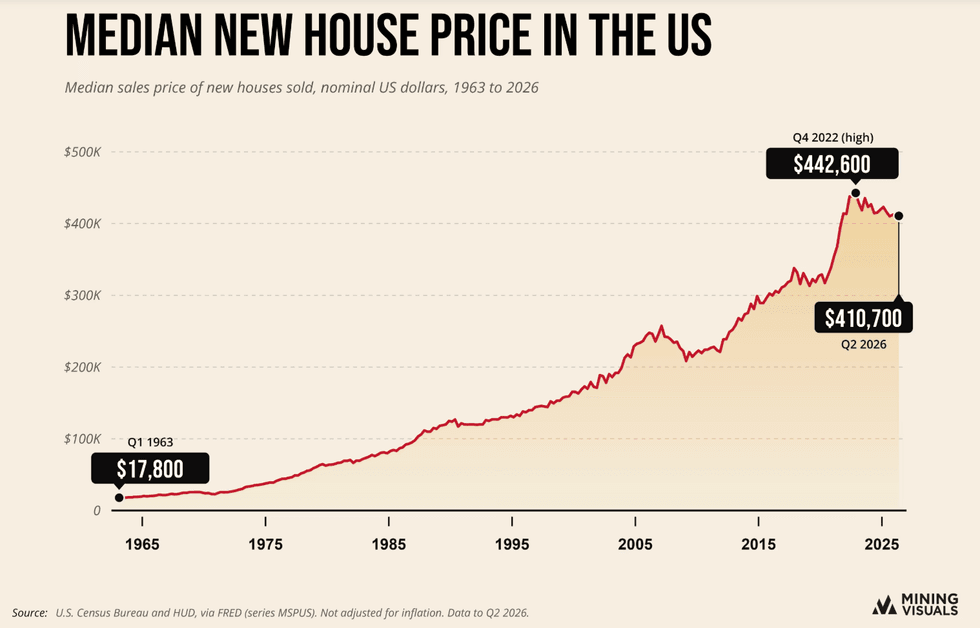
Infographic via MiningVisuals.
Builders are behind much of the weakness. In August, 35 percent of US home builders cut prices, by an average of 6 percent, and 63 percent offered buyers other incentives, according to the National Association of Home Builders’ monthly survey.
HousingWire attributes much of the median’s decline since 2022 to builders selling more smaller, lower-priced homes. Builders are also paying for mortgage-rate buydowns, which lower the buyer’s interest rate, the publication reports.
Gold’s own pullback nudged the ratio back up in the second quarter. Bullion’s average of US$4,512 came in below the first quarter’s US$4,876 as the metal eased from its early-2026 record, lifting the cost of a new house from 84 ounces to 91.
The ounce count hit its high of 684 in 1970, when governments, not markets, set the price of gold. The Bretton Woods system pegged gold at US$35 an ounce. From March 1968, only central banks traded at that price while everyone else paid a market rate, and the US stopped exchanging dollars for gold in August 1971, according to Federal Reserve History.
With gold pinned near US$35, rising house prices did all the work. From the first quarter of 1963 to the second quarter of 1970, the median new-home price rose 37 percent, while gold’s average price gained just 2 percent, to US$35.67.
Later lows came at the end of gold’s record runs. Gold hit a then-record US$850 in January 1980, and the ounce count fell to 100 that year. It then dropped to 131 in the third quarter of 2011, when gold set its September record of US$1,920.
MiningVisuals’ series runs through the second…
Read More: Infographic: A New US Home Now Costs Under 100 Ounces of Gold