
Gold Price Trends: Q2 2026 Review and Forecast
The gold price experienced strong volatility in the second quarter of 2026.
It traded in a range of US$3,960 to US$4,850 per ounce during a period that saw the Iran war drag on longer than the Trump administration had expected, and the US Federal Reserve enter a new era under Chair Kevin Warsh.
As Q3 begins, Iran still has its trump card — the Strait of Hormuz, through which about 20 percent of global oil flows. Even if a peace deal is reached soon, the Fed will have to grapple with sticky inflation.
Is gold a safe-haven asset investors turn to when times are tough, or is the precious metal serving another role in a tumultuous macroeconomic environment? Does it have enough runway in the remainder of the year to retake all-time highs? Or will we see gold slide further beyond the US$4,000 floor of support?
The Investing News Network (INN) turned to gold market experts to answer these questions and gain insight into what moved the yellow metal’s price in the second quarter.
What happened to the gold price in Q2?
“(Gold) had a difficult second quarter after a strong start to the year,” Eugenia Mykuliak, founder and executive director of B2PRIME Group, told INN via email. “The main driver has been a stronger US dollar combined with persistently elevated treasury yields, which reduced the appeal of non-yielding assets and prompted investors to unwind some of the enthusiasm that had built up during the first quarter.”
Gold began Q2 with a close of US$4,699.55 on April 1, and reached its peak daily close on April 14 at US$4,840.
For much of the period, gold was impacted by the belief that an end to the US-Iran war was on the horizon. On April 8, the Trump administration made plenty of fanfare about its proposed two week ceasefire arrangement, which involved Iran agreeing to allow safe passage for ships through the Strait of Hormuz.
At the same time, lower-than-expected producer price index (PPI) data for March gave gold a boost. Since producer costs are passed on to consumers, PPI is an important inflationary signal to the Fed.
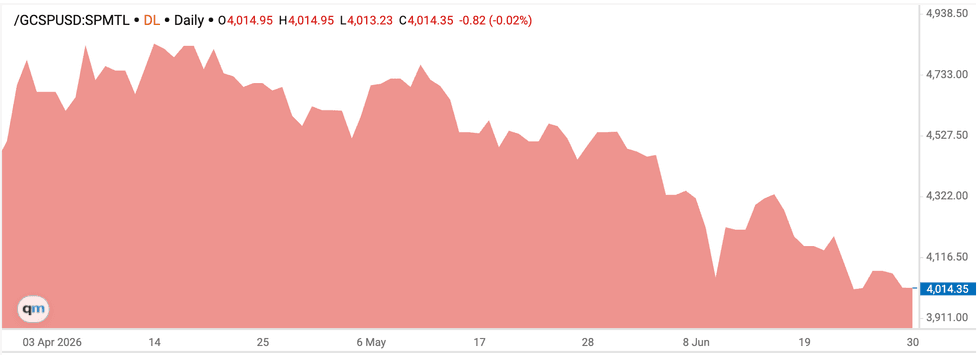
Gold price, Q2 2026.
Chart via the Investing News Network.
Gold’s upward trajectory didn’t last long, however, and the second half of April was much more volatile.
On April 20, Iran threatened retaliation following reports that the US Navy had seized an Iranian cargo ship in the Strait of Hormuz. The resulting surge in oil prices benefited both treasury yields and the US dollar at the expense of non-yielding gold. Alongside the high-stakes US-Iran conflict, the confirmation hearing for Warsh signaled a hawkish shift at the Fed. By the next day, gold had slipped to a close of US$4,720.56.
The following week, hopes of a peace deal had evaporated, and the Fed had decided to hold interest rates steady. On April 29, the price of gold fell as low as US$4,510.62 in morning trade. Gold continued to test the US$4,500 floor of support in early May with a close of US$4,519….