
Ethereum’s Price Action Paints One Of Its Worst Charts Ever, What Comes

Ethereum, the second-largest digital asset has been lagging behind other major crypto assets, raising questions about its short-term prospects. While these coins have achieved new all-time highs in the ongoing cycle, ETH has been on a downtrend after revisiting the $4,000 level. A crypto analyst considers the current action as one of the worst since the asset entered the market.
Worst Ethereum Chart In Years Emerges
The bearish state of the market has been reflected significantly in Ethereum price action in the past several weeks. Seasoned crypto analyst and trader Mags revealed that ETH is at a pivotal moment as it grapples with severe negative performance.
Delving into ETH’s action in the ongoing bull market cycle, Mags highlighted that the altcoin has “one of the worst charts of all time.” His prognosis implies that this current bull cycle might be the least productive for the asset since its inception, with traders uncertain about its potential of hitting a new all-time this cycle.
Looking at the chart, Ethereum seems to have made multiple bullish attempts in the past year that were cut short by strong resistance. Mags noted that the price tried 3 times throughout this cycle but failed to break above the range high of $4,000.
Each failed attempt has led to a deeper retracement as seen in the chart. On the last rejection, the price broke down much lower than the mid-range in addition to trading below the upward-slopping trendline support from the cycle bottom.
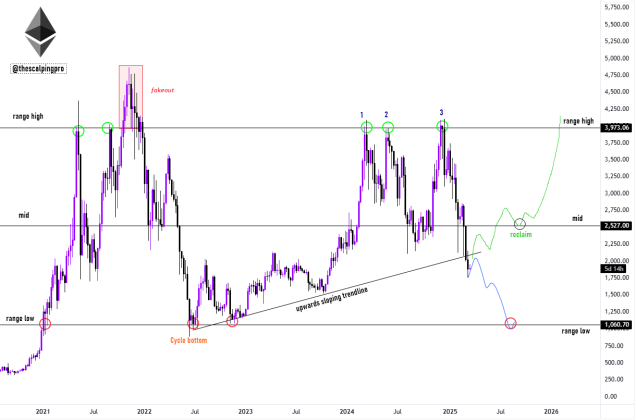
As a result, the market expert has identified two potential paths for its price trajectory in the short term. One path suggests a much larger bearish movement and the other hints at a significant upside trend, allowing it to reclaim critical resistance levels and triggering renewed momentum.
For the first scenario, Mags has pointed out that ETH keeps heading toward the downside without any major support. Thus, he believes that the altcoin is at risk of a deeper decline to the range low of $1,060. In the second scenario, Mags claims ETH might move to the $4,000 mark to make another bullish breakout attempt after reclaiming the $2,500 level.
However, from a more technical standpoint, the expert is confident that the bearish scenario is more likely to happen, predicting an extension of the ongoing descent. Meanwhile, for ETH to turn bullish again, it must at least revisit the upward-slopping trendline on the chart.
Breakout Opportunity Emerges For ETH
While ETH eyes further decrease, key developments hint at growing momentum for an upsurge. Technical expert Jonathan Carter has spotted a Descending Channel formation on the Ethereum chart in the 2-hour time frame.
Historically, a descending channel pattern has served as a precursor for an upswing. With the price trading within…
Read More: Ethereum’s Price Action Paints One Of Its Worst Charts Ever, What Comes