
The Positive End To 2024 For Bitcoin
As 2024 comes to a close, Bitcoin investors are eagerly eyeing the final quarter of the year, traditionally known for positive price action. With many speculating that a bullish rally may be on the horizon, let’s break down the historical data, analyze trends, and weigh the possibilities of what BTC’s price action might look like by the end of this year.
Historical Performance of Bitcoin in Q4
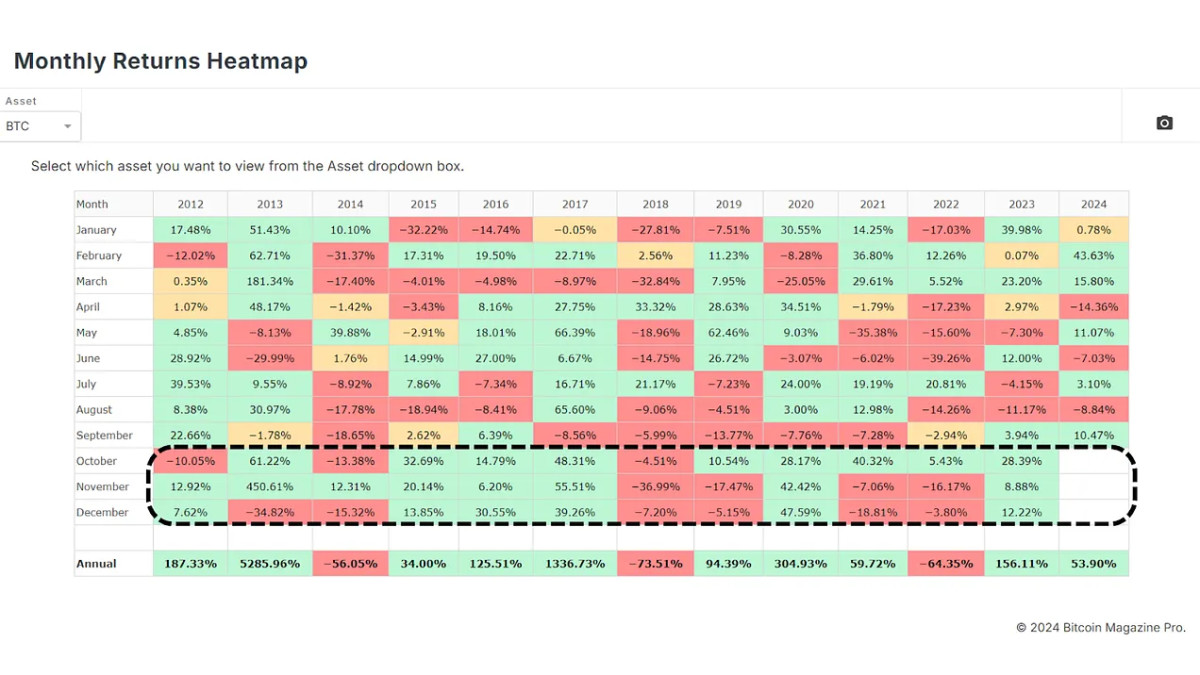
Looking at the past decade on the Monthly Returns Heatmap, Q4 has frequently delivered impressive gains for Bitcoin. Data shows that BTC often finishes the year strong, as evidenced by three consecutive green months in 2023. Not every year follows this trend however, 2021 and 2022 were less favorable, with Bitcoin ending the year on a more bearish note. Yet, years like 2020 and 2015 through to 2017 saw tremendous price surges, highlighting the potential for a bullish finish in Q4.

Analyzing Potential Q4 2024 Outcomes Based on Historical Data
To better understand potential outcomes for Q4 2024, we can compare previous Q4 performances with the current price action. This can give us an idea of how Bitcoin might behave if historical patterns continue. The range of potential outcomes is broad, from significant gains to minor losses, or even sideways price movement. The projection lines are rainbow color coded going from 2023 in red back to 2015 in a light violet shade.
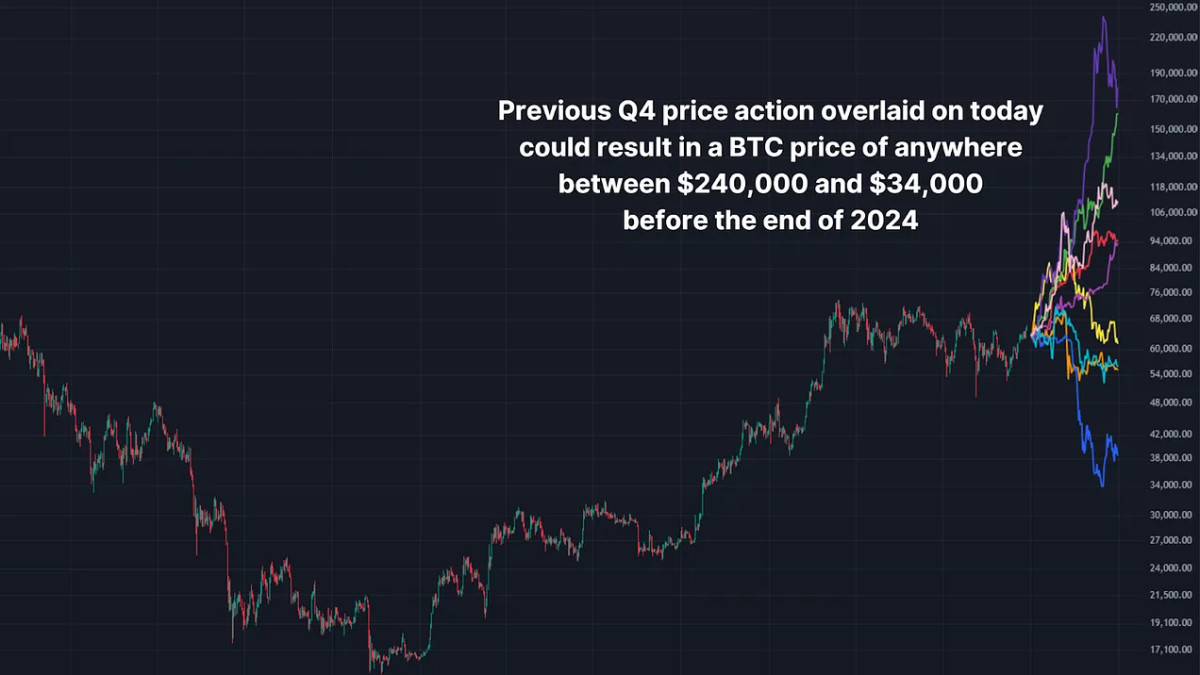
For example, in 2017 (purple line), Bitcoin experienced a significant increase, suggesting that in an optimistic scenario, Bitcoin could reach prices as high as $240,000 by the end of 2024.
However, more conservative estimates are also possible. In a more moderate Q4, Bitcoin could range between $93,000 and $110,000, while in a bearish scenario, prices could drop as low as $34,000, as seen in 2018 (blue line).
The median outcome based on this data seems to be around the $85,000 price point. Although this is based on the year end price from these projections, years such as 2021 (yellow line) resulted in considerably higher price before notable pullbacks to end the year.
Is The Median Outcome A Possibility?
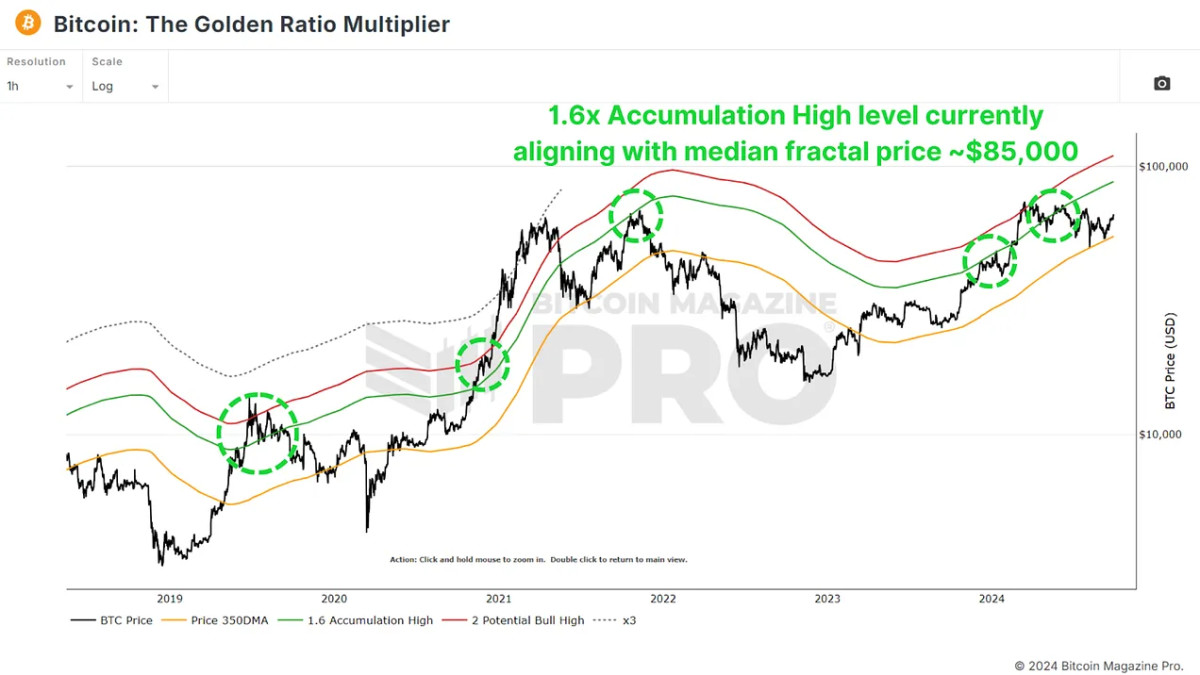
Whilst an $85,000 in around three months time may seem optimistic, we only have to look back to February of this year to see a single month in which BTC experienced a 43.63% increase. We can also look to metrics such as The Golden Ratio Multiplier which are showing confluence around this level as a potential target with its 1.6x Accumulation High level.
Read More: The Positive End To 2024 For Bitcoin