
Are Bitcoin Whales Buying The Dip?
Bitcoin’s recent price volatility has led many to wonder if large-scale bitcoin hodlers are taking advantage of price dips to accumulate more bitcoin. While some metrics may initially suggest an increase in long-term holdings, a closer examination reveals a more nuanced story, especially after the current prolonged period of choppy consolidation.
Are Long-Term Holders Accumulating?
Upon initial observation, long-term Bitcoin holders are seemingly increasing their holdings. According to the Long Term Holder Supply, since July 30th, the amount of BTC held by long-term holders has increased from 14.86 million to 15.36 million BTC. This surge of around 500,000 BTC has led some to believe that long-term holders are aggressively buying the dip, potentially setting the stage for the next significant price rally.
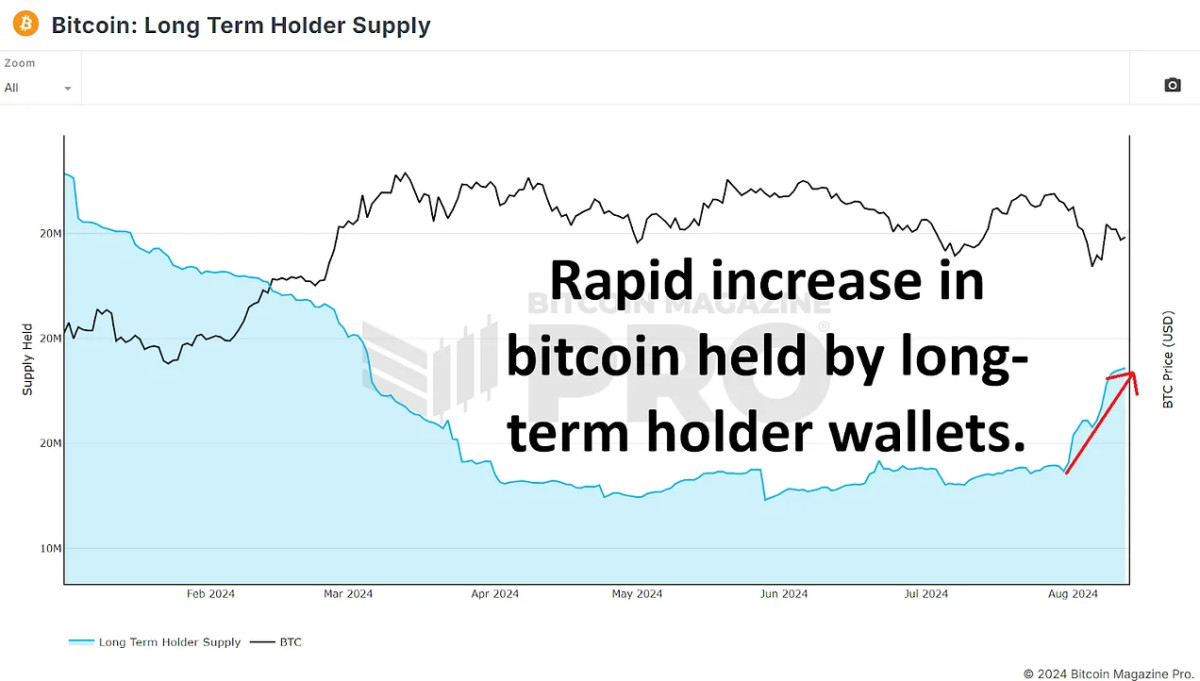

However, this interpretation might be misleading. Long-term holders are defined as wallets that have held BTC for 155 days or more. This week we’ve just surpassed 155 days since our most recent all-time high. Therefore, it is likely that many short-term holders from that period have simply transitioned into the long-term category without any new accumulation occurring. These investors are now holding onto their BTC, hoping for higher prices. So in isolation, this chart does not necessarily indicate new buying activity from established market participants.
Coin Days Destroyed: A Contradictory Indicator
To further explore the behavior of long-term holders, we can examine the Supply Adjusted Coin Days Destroyed metric over the recent 155-day period. This metric measures the velocity of coin movement, giving more weight to coins that have been held for extended periods. A spike in this metric could indicate that long-term holders possessing a substantial amount of bitcoin are moving their coins, likely indicating more selling as opposed to accumulating.
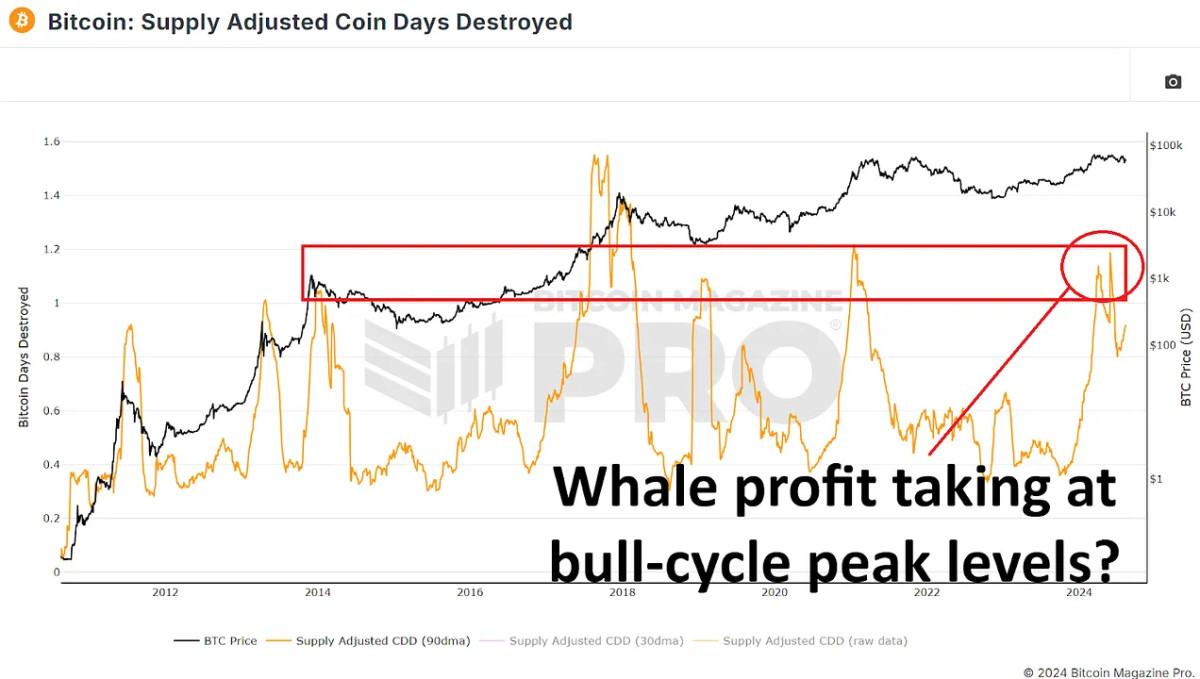
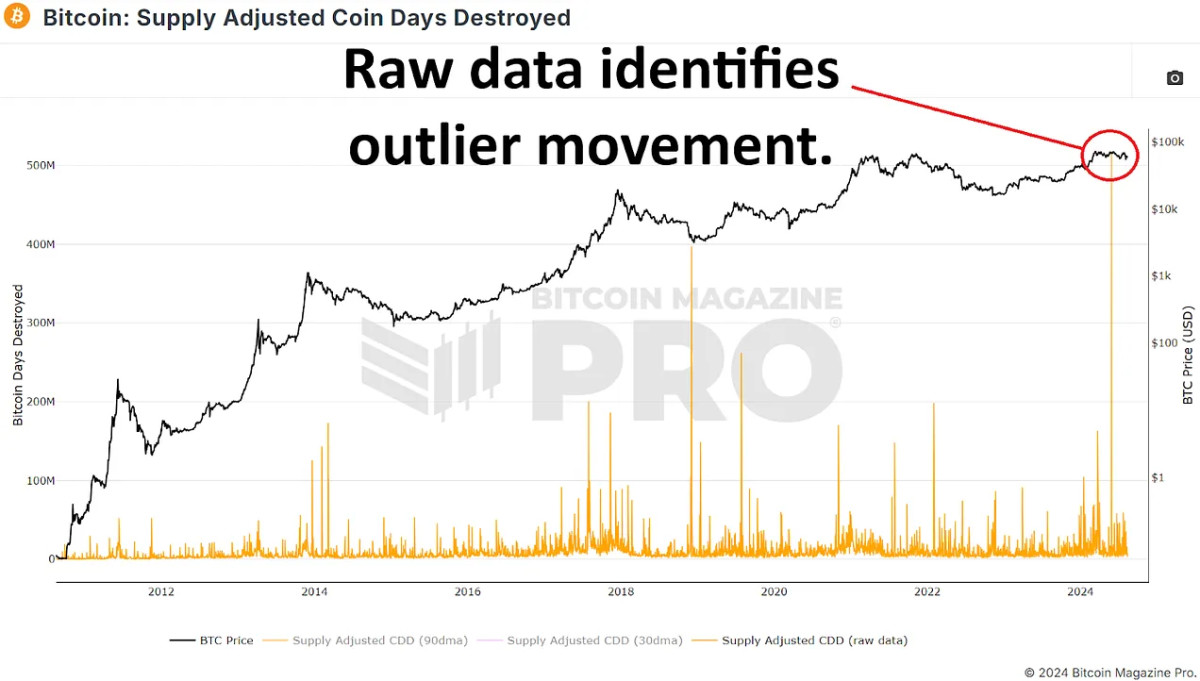
Recently, we have seen a significant increase in this data, suggesting that long-term holders might be distributing rather than accumulating BTC. However, this spike is primarily skewed by a single massive transaction of around 140,000 BTC from a known Mt. Gox wallet on May 28, 2024. When we exclude this outlier, the data appears much more typical for this stage in the market cycle, comparable to periods in late 2016 and early 2017 or mid-2019 to early 2020.
Read More: Are Bitcoin Whales Buying The Dip?